ClickHouse Performance Optimization: Best Practices for Ultra-Fast Analytics
Introduction
ClickHouse is a high-performance, open-source columnar database designed for real-time analytical queries on large datasets. Its speed stems from columnar storage, vectorized query execution, and advanced optimizations like lazy materialization. However, achieving peak performance requires careful tuning of schema design, queries, and system configuration. This document outlines proven strategies to optimize ClickHouse performance, drawing from recent advancements and community insights, including a notable optimization highlighted in a 2025 X post about lazy materialization.
1. Schema Design Optimization
A well-designed schema is the foundation of ClickHouse performance. The following practices ensure efficient data storage and retrieval.
1.1 Primary Key and Sorting Order
- Choose Low-Cardinality Columns: Use low-cardinality fields (e.g., timestamp, category) as the first columns in the ORDER BY clause to minimize data scanning. High-cardinality fields (e.g., UUID) should be placed last or avoided in the primary key.
- Example:
- sql
CREATE TABLE events ( timestamp DateTime, category String, event_id UUID ) ENGINE = MergeTree() ORDER BY (timestamp, category, event_id);- Avoid Over-Indexing: Indexes on high-cardinality columns increase storage overhead without significant performance gains.
1.2 Data Types and Compression
- Use LowCardinality for Strings: Apply the LowCardinality type to string columns with limited unique values (e.g., categories, statuses) to reduce memory usage and speed up queries.

- Avoid Nullable Columns: Nullable columns add an extra bitmask, increasing processing overhead. Check for unnecessary Nullable usage with:
- sql
SELECT column_name, count(*) FROM table WHERE column_name IS NULL GROUP BY column_name;- Optimize Compression: Use LZ4 for real-time scenarios or ZSTD for better compression ratios. For example:
- sql
CREATE TABLE logs ( id UInt64, message String CODEC(ZSTD) ) ENGINE = MergeTree();
Image Placeholder 1: A diagram comparing query execution times for a table with LowCardinality vs. regular String columns, showing reduced memory usage and faster query response.
2. Query Optimization Techniques
Efficient queries minimize I/O, CPU, and memory usage. Recent advancements, such as lazy materialization, have significantly boosted query performance for specific patterns.
2.1 Lazy Materialization
- What It Does: Lazy materialization, introduced in recent ClickHouse versions, delays reading large columns until absolutely necessary, reducing I/O. This is particularly effective for Top N queries with LIMIT clauses, as highlighted in a 2025 X post.
- Example: A query like the following benefits from lazy materialization by deferring column reads until after sorting and limiting:
- sql
SELECT product_title, review_body FROM amazon_reviews WHERE helpful_votes > 0 ORDER BY -log(1 - (rand() / 4294967296.0)) / helpful_votes LIMIT 3;- Impact: A real-world example showed a query time reduction from 219 seconds to 139 milliseconds — a 1,576× speedup — without changing the SQL.
2.2 Materialized Views and Projections
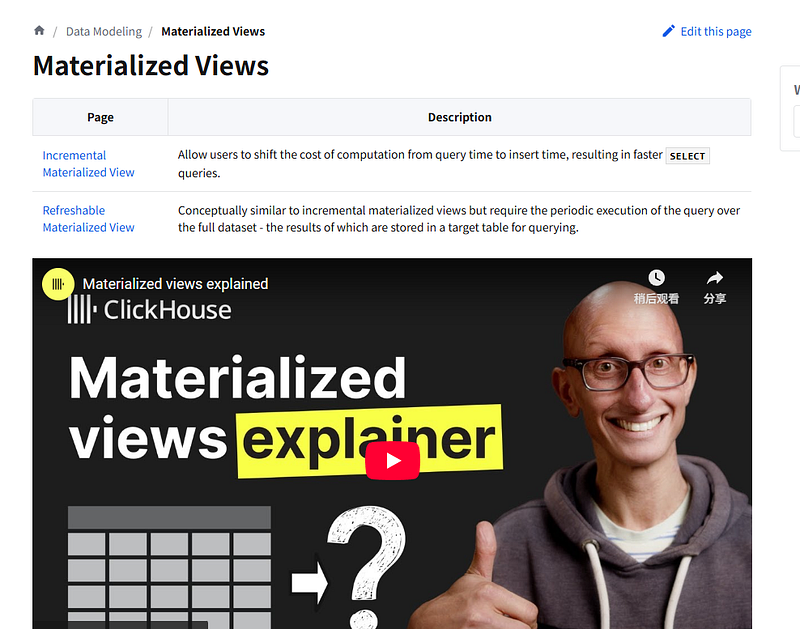
- Materialized Views: Precompute aggregates for frequent queries to avoid runtime calculations.
- Example:
- sql
CREATE MATERIALIZED VIEW daily_sales ENGINE = AggregatingMergeTree() ORDER BY date AS SELECT date, SUM(revenue) AS total_revenue FROM sales GROUP BY date;- Projections: Store alternative data layouts for specific query patterns, reducing data scans.
- Example:
- sql
ALTER TABLE sales ADD PROJECTION sales_by_category ( SELECT category, SUM(revenue) GROUP BY category );
2.3 Query Best Practices
- Avoid SELECT *: Specify only needed columns to reduce I/O.
- Use PREWHERE for Filters: Move small-column filters to PREWHERE to prune data early.
- sql
SELECT id, name FROM users PREWHERE active = 1 WHERE age > 30;- Leverage Primary Keys: Ensure WHERE clauses use primary key columns to skip irrelevant data granules.
- Analyze Query Plans: Use EXPLAIN indexes = 1 to inspect the query execution plan and identify bottlenecks.
Image Placeholder 2: A flowchart showing the query execution pipeline in ClickHouse, highlighting stages where lazy materialization and PREWHERE reduce data processing.
3. System and Hardware Configuration
ClickHouse’s performance is heavily influenced by hardware and configuration settings.
3.1 Hardware Recommendations
- CPU: Use high-core-count CPUs (e.g., AMD EPYC, Intel Xeon) with AVX-512 for vectorized query execution.
- Memory: Aim for 64GB+ RAM to cache hot data. Configure max_memory_usage to balance query needs.
- Storage: Use NVMe SSDs with RAID-10 for high IOPS and low latency. Avoid NFS and prefer Ext4.
- Network: Use 10GbE+ for distributed queries to minimize latency.
3.2 Configuration Tuning
- Parallelism: Increase max_threads to utilize more CPU cores and adjust max_concurrent_queries for workload balance.
- Merges: Monitor system.merges to ensure merges don’t overwhelm resources. Avoid frequent OPTIMIZE TABLE FINAL, as it’s resource-intensive.
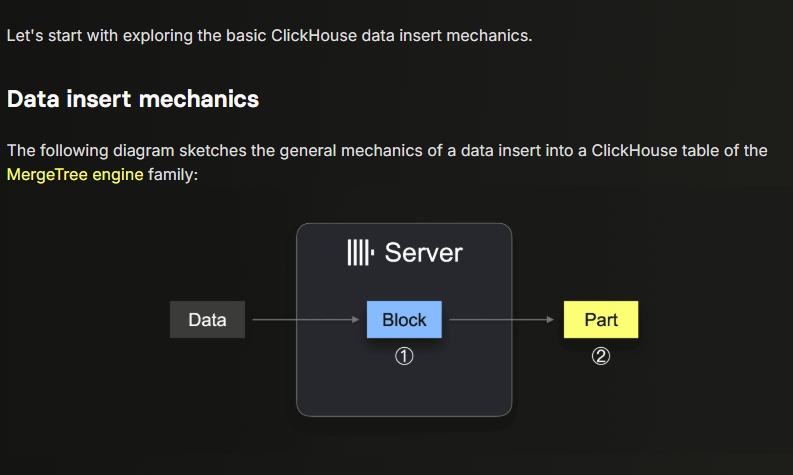
- Batch Inserts: Use large batch inserts (e.g., via Kafka Connect Sink) to reduce the number of data parts and merge overhead.
Image Placeholder 3: A bar chart comparing query performance on different hardware setups (e.g., HDD vs. SSD, 16GB vs. 64GB RAM), showing reduced latency with optimized hardware.
4. Monitoring and Debugging
Continuous monitoring is critical to identify and resolve performance bottlenecks.
4.1 System Tables
- Query Log: Use system.query_log to analyze slow queries:
- sql
SELECT query, read_rows, result_rows, query_duration_ms FROM system.query_log WHERE event_date = today() AND read_rows > 1000000 ORDER BY query_duration_ms DESC LIMIT 10;- Merges: Check system.merges for merge performance:
- sql
SELECT database, table, elapsed, progress FROM system.merges;- Parts: Monitor system.parts to detect excessive small parts, indicating suboptimal insert patterns.
4.2 Query Insights UI
- The new Query Insights UI in ClickHouse Cloud Console simplifies query log analysis, offering metrics like p99/p90/p50 latency and context-based optimization suggestions.
4.3 Benchmarking
- Disable filesystem cache during testing to expose I/O issues:
- bash
echo 3 | sudo tee /proc/sys/vm/drop_caches >/dev/null- Use tools like ClickBench to simulate workloads and measure performance changes.
Image Placeholder 4: A screenshot of the ClickHouse Query Insights UI, showing a dashboard with query latency metrics and optimization suggestions.
5. Recent Advancements
A 2025 X post highlighted lazy materialization as a game-changer for query performance, particularly for Top N queries with random sampling. This optimization, combined with ClickHouse’s vectorized query execution and SIMD instructions, ensures it remains one of the fastest analytical databases. The VLDB 2024 paper also provides deep insights into ClickHouse’s architecture, emphasizing its use of parallelized query processing and data compression.

6. Best Practices Checklist
- Schema: Use low-cardinality primary keys, avoid nullable columns, and apply compression codecs.
- Queries: Leverage lazy materialization, materialized views, and projections; avoid full table scans.
- System: Optimize hardware (SSD, high RAM, fast CPU), tune parallelism, and monitor merges.
- Monitoring: Regularly analyze system.query_log, use Query Insights UI, and benchmark changes.
Conclusion
Optimizing ClickHouse performance requires a structured approach to schema design, query tuning, and system configuration. Recent advancements like lazy materialization, as noted in community discussions on X, have further enhanced ClickHouse’s capabilities, enabling dramatic speedups for analytical workloads. By following the best practices outlined in this document and continuously monitoring performance, you can ensure ClickHouse delivers ultra-fast analytics for your use case.
For further reading, explore the ClickHouse documentation (https://clickhouse.com/docs) or the VLDB 2024 paper for in-depth architectural insights.


Member discussion